
Objetivo
Use este modelo do OpMon para monitorar através do NSClient++ os indicadores de um Microsoft Web Service.
Público-alvo
Administradores que necessitam monitorar informações importantes sobre um servidor Microsoft Web Service, obtidas através do modelo Microsoft Web Service.
Pré-requisitos
- OpMon 7.0 ou superior;
- Possuir o OpMon instalado.
- Possuir o agente NRPE instalado, como realizar a instalação pode ser vista neste link.
Serviços Disponíveis
- Contadores:
- Web Service CacheCurrent Files Cached
- Web Service CacheCurrent Metadata Cached
- Web Service CacheCurrent URIs Cached
- Web Service CacheFile Cache Hits %
- Web Service CacheMetadata Cache Hits
- Web Service CacheURI Cache Hits %
- Web Service(_Total)Anonymous Users/sec
- Web Service(_Total)Bytes Received/sec
- Web Service(_Total)Bytes Sent/sec
- Web Service(_Total)Bytes Total/sec
- Web Service(_Total)CGI Requests/sec
- Web Service(_Total)Connection Attempts/sec
- Web Service(_Total)Copy Requests/sec
- Web Service(_Total)Current Anonymous Users
- Web Service(_Total)Current Blocked Async I/O Requests
- Web Service(_Total)Current blocked bandwidth bytes
- Web Service(_Total)Current CAL count for authenticated users
- Web Service(_Total)Current CAL count for SSL connections
- Web Service(_Total)Current CGI Requests
- Web Service(_Total)Current Connections
- Web Service(_Total)Current ISAPI Extension Requests
- Web Service(_Total)Current NonAnonymous Users
- Web Service(_Total)Delete Requests/sec
- Web Service(_Total)Files Received/sec
- Web Service(_Total)Files Sent/sec
- Web Service(_Total)Files/sec
- Web Service(_Total)Get Requests/sec
- Web Service(_Total)Head Requests/sec
- Web Service(_Total)ISAPI Extension Requests/sec
- Web Service(_Total)Lock Requests/sec
- Web Service(_Total)Locked Errors/sec
- Web Service(_Total)Logon Attempts/sec
- Web Service(_Total)Maximum CAL count for authenticated users
- Web Service(_Total)Maximum CAL count for SSL connections
- Web Service(_Total)Maximum CGI Requests
- Web Service(_Total)Maximum Connections
- Web Service(_Total)Maximum ISAPI Extension Requests
- Web Service(_Total)Maximum NonAnonymous Users
- Web Service(_Total)Measured Async I/O Bandwidth Usage
- Web Service(_Total)Mkcol Requests/sec
- Web Service(_Total)Move Requests/sec
- Web Service(_Total)NonAnonymous Users/sec
- Web Service(_Total)Not Found Errors/sec
- Web Service(_Total)Options Requests/sec
- Web Service(_Total)Other Request Methods/sec
- Web Service(_Total)Post Requests/sec
- Web Service(_Total)Propfind Requests/sec
- Web Service(_Total)Proppatch Requests/sec
- Web Service(_Total)Put Requests/sec
- Web Service(_Total)Search Requests/sec
- Web Service(_Total)Service Uptime
- Web Service(_Total)Total Allowed Async I/O Requests
- Web Service(_Total)Total Anonymous Users
- Web Service(_Total)Total Blocked Async I/O Requests
- Web Service(_Total)Total blocked bandwidth bytes
- Web Service(_Total)Total Bytes Received
- Web Service(_Total)Total Bytes Sent
- Web Service(_Total)Total Bytes Transferred
- Web Service(_Total)Total CGI Requests
- Web Service(_Total)Total Connection Attempts (all instances)
- Web Service(_Total)Total Copy Requests
- Web Service(_Total)Total count of failed CAL requests for authenticated users
- Web Service(_Total)Total count of failed CAL requests for SSL connections
- Web Service(_Total)Total Delete Requests
- Web Service(_Total)Total Files Received
- Web Service(_Total)Total Files Sent
- Web Service(_Total)Total Files Transferred
- Web Service(_Total)Total Get Requests
- Web Service(_Total)Total Head Requests
- Web Service(_Total)Total ISAPI Extension Requests
- Web Service(_Total)Total Locked Errors
- Web Service(_Total)Total Logon Attempts
- Web Service(_Total)Total Method Requests
- Web Service(_Total)Total Method Requests/sec
- Web Service(_Total)Total Mkcol Requests
- Web Service(_Total)Total Move Requests
- Web Service(_Total)Total NonAnonymous Users
- Web Service(_Total)Total Not Found Errors
- Web Service(_Total)Total Options Requests
- Web Service(_Total)Total Other Request Methods
- Web Service(_Total)Total Post Requests
- Web Service(_Total)Total Propfind Requests
- Web Service(_Total)Total Proppatch Requests
- Web Service(_Total)Total Put Requests
- Web Service(_Total)Total Rejected Async I/O Requests
- Web Service(_Total)Total Search Requests
- Web Service(_Total)Total Trace Requests
- Web Service(_Total)Total Unlock Requests
- Web Service(_Total)Trace Requests/sec
- Web Service(_Total)Unlock Requests/sec
Aplicando o Modelo de Monitoramento
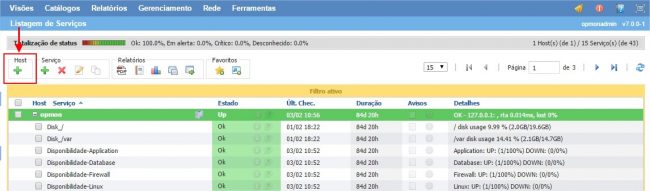
Na área de gerenciamento de hosts ou de serviços basta clicar no ícone “+” para adicionar um novo Host, conforme abaixo demonstrado:
Nessa área selecione a categoria de modelos “Windows”:

Em seguida, no modelo Microsoft Web Service, selecione o botão “Usar este modelo”:

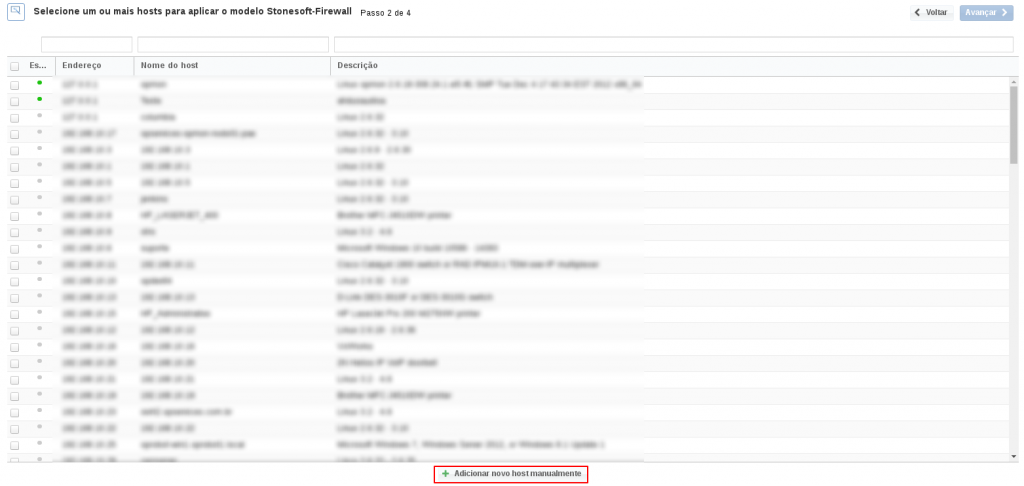
Este modelo pode ser aplicado no próprio host do Windows, ou se desejar, pode adicionar um novo host apenas para esse monitoramento, para isso clique em “Adicionar novo host manualmente”:
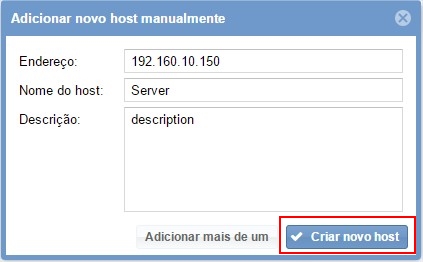
Nessa área insira as informações relativas ao Host, neste caso o Windows em questão e em seguida clique em “Criar novo host”:
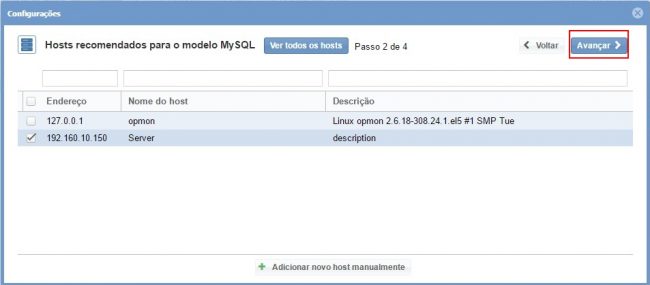
Nessa área, com o host selecionado clique em “Avançar”:
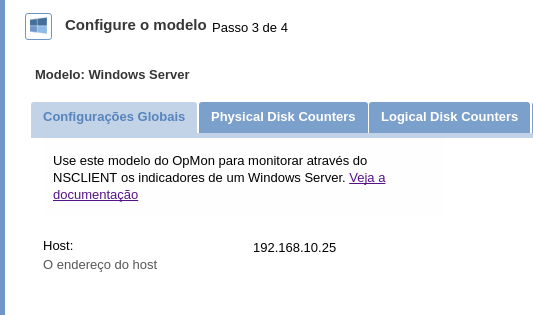
Em seguida você visualizará uma tela similar a abaixo demonstrada, onde é exibido as informações do IP do Microsoft Web Service:
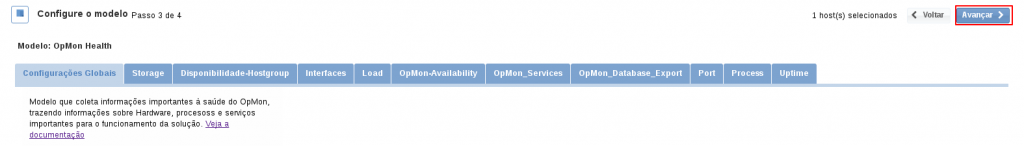
Para fazer as definições dos serviços basta navegar entre eles utilizando os botões “Avançar” e “Voltar”:
Após concluída a definição dos serviços, basta avançar até a área de revisão dos itens incluídos. Aproveite para observar que é possível expandir a área de revisão de hosts e serviços, basta clicar no ícone “+” conforme demonstrado:
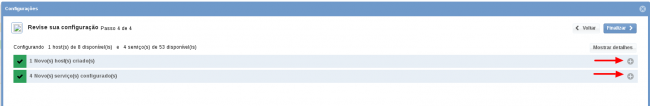
Nessa área observe que é possível fazer alterações caso necessário. Feitas as definições basta clicar em “Finalizar” para concluir o processo de aplicação do modelo.

Pronto! os elementos foram incluídos com sucesso ao monitoramento.